
You've asked an AI agent to deploy a branch to a devbox. The agent reports that the work is complete, but the preview URL returns an error. The web dashboard shows a red deployment badge and a short failure message. That's enough to tell you something went wrong, but not enough to explain why.
You open the live terminal, inspect the application output, check the process state, and find the actual problem: a background worker started before its dependency was ready. The GUI gave you fleet-level awareness. The command line gave you the evidence and control needed to fix the machine.
That experience captures the modern GUI vs command line debate better than an argument about desktop operating systems. AI agent workflows need both interfaces. A dashboard helps people understand what's running across a fleet, while a terminal exposes the underlying state when automation behaves unexpectedly.
Table of Contents
The Reality of Managing AI Agents
An AI agent can write a branch, install dependencies, start services, and report success without producing a usable application. The problem isn't always that the agent failed to act. Sometimes it acted in the wrong environment, used stale configuration, started services in the wrong order, or encountered an error that its summary didn't preserve.
A web console is excellent at showing the broad shape of the situation. You can see which agents are online, which devboxes are active, whether a deployment completed, and whether a preview is available to the team. That view matters when several agents are working at once, because opening a separate terminal for every machine creates its own operational burden.
| Job | GUI dashboard | Live terminal |
|---|---|---|
| Fleet overview | Clear status across agents and devboxes | Requires checking machines individually |
| Deployment initiation | Accessible for branch selection and lifecycle actions | Repeatable from scripts and automation |
| Error discovery | Useful summaries, badges, and recent events | Raw stdout, stderr, processes, and files |
| Configuration review | Convenient forms and visible settings | Exact values, diffs, and environment inspection |
| Repeated operations | Possible, but often tied to interface flows | Easy to script, chain, and version |
| Ad hoc recovery | Good for restart or lifecycle controls | Precise commands for unusual failures |
The failure becomes more stressful when the dashboard hides too much. A message such as “deployment failed” doesn't tell you whether the issue came from a missing package, an invalid environment variable, a failed migration, a port conflict, or a process that exited immediately.
The dashboard answers “what”
During routine operations, the GUI should be the first place many team members look. A product manager reviewing agent activity doesn't need a shell session to confirm that a branch has a preview. A support lead checking shared agent memory benefits from a persistent visual record rather than a collection of terminal tabs.
The same applies to lifecycle work. Provisioning a machine, selecting a repository, reviewing access settings, extending a devbox, and removing an obsolete environment are easier to understand when the platform presents them as explicit controls. A dashboard reduces the amount of operational knowledge required to perform safe, common actions.
Practical rule: Use the GUI to establish the state of the fleet before you reach for a command.
The terminal answers “why”
The live shell becomes essential when the visible state doesn't explain the behavior. You can inspect the actual files, follow unfiltered application logs, query a process, verify installed dependencies, and test a service from inside the machine where it runs.
That distinction also affects AI agents themselves. An agent can be asked to investigate a failure through a terminal because the shell exposes the same filesystem and process environment that caused the problem. The human operator can then validate the agent's diagnosis instead of trusting a polished completion message.
A productive workflow doesn't ask whether the GUI or CLI is superior. It assigns each interface a job. The dashboard handles orientation, permissions, and lifecycle. The terminal handles inspection, diagnosis, and repeatable intervention.
Historical Context and Modern Automation Benchmarks
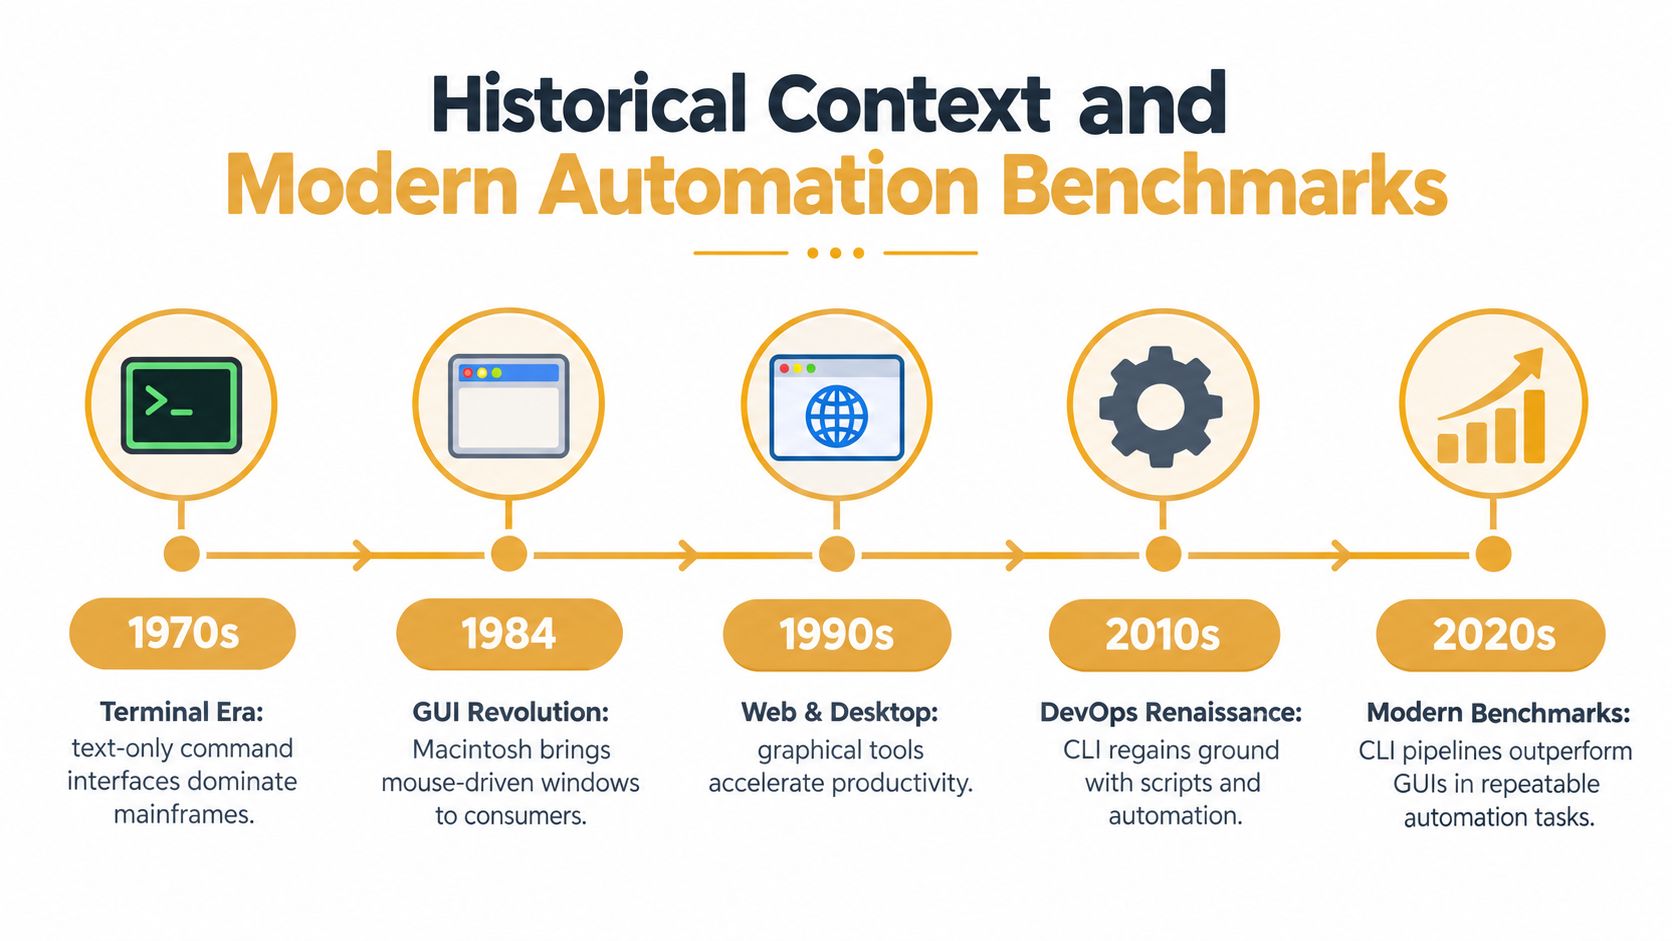
The GUI versus CLI question started as a systems problem and now shapes how hosted AI agents are operated. Early command-line systems provided direct control through typed instructions, while graphical research introduced windows, pointers, menus, and desktop metaphors. Modern agent platforms combine both patterns: a GUI dashboard gives teams a fleet-level view, while a live terminal exposes the machine's actual state for debugging and automation.
Xerox PARC's Alto was developed in 1973 and is widely cited as the first computer to demonstrate a desktop metaphor and graphical user interface. The Apple Macintosh followed in 1984 and became the first commercially successful product to use a multi-panel window interface. Windows 1.0 arrived in 1985 as a graphical layer for MS-DOS.
Commercial adoption reinforced the technical shift. Apple had sold about 1 million Macintoshes by 1988, according to Macintosh commercial history. Windows 3.0 and 3.1 helped graphical computing reach mainstream PC users in 1990 and 1992. The GUI became the standard surface for everyday work, while terminals remained available for operations that were difficult to represent visually.
Coexistence was the outcome
The GUI did not remove the command line. It moved common consumer tasks into a visual layer and left the terminal central to systems work, automation, and expert workflows. A history of command-line and graphical computing traces modern GUI ideas to Sketchpad in the 1960s and Xerox Alto in 1973, while describing the command line's continued role beneath and alongside graphical systems.
That division maps directly to AI agent hosting. A dashboard helps an operator review many agents, inspect lifecycle state, and understand which environments need attention. A terminal lets an agent or engineer inspect files, run tools, query processes, and repeat a procedure without depending on screen layout. The strongest managed workflows use the dashboard for fleet oversight and the terminal for live diagnosis, rather than forcing one interface to handle both jobs.
Neither interface guarantees better automation. The agent still needs appropriate skills, usable feedback, and checks that confirm whether an action produced the intended result.
Benchmarks expose the skill problem
A controlled benchmark evaluated 440 desktop tasks across 18 applications and 12 workflow categories. The strongest screen-only GUI agent achieved a 59.1% full pass rate, while the strongest original-skill CLI agent reached 48.2%. After verifier-guided skill augmentation, the CLI agent reached 69.3%, according to the desktop automation benchmark.
The result measures skill coverage as well as interface capability. After receiving additional skills and verification support, the command-line agent performed above the screen-only GUI agent in that benchmark.
Hosted agents need both layers configured properly. A terminal without failure inspection, output validation, and recovery procedures leaves the agent guessing. A GUI without reliable visual grounding and verification can let an agent complete clicks without confirming the final state.
The interface is one part of the automation system. The surrounding skills and verification determine whether the workflow can be trusted.
Comparing Web Consoles and Terminal Access
A web console and a live terminal solve different operational problems. The console makes shared state legible to a team. The terminal gives an engineer direct access to the machine's current reality.
That distinction becomes clearer when the criteria are concrete. Fleet monitoring, configuration review, debugging depth, and automation potential each favor a different interface.
| Capability | Web Console (GUI) | Live Terminal (CLI) |
|---|---|---|
| Fleet visibility | Shows agents, devboxes, lifecycle state, access status, and recent events in one place | Offers deep visibility into one machine at a time unless you build your own aggregation |
| Configuration management | Makes common settings discoverable and reduces accidental edits | Exposes exact files, values, generated output, and environment state |
| Debugging depth | Surfaces summaries, alerts, logs, and common controls | Lets you inspect stdout, stderr, processes, files, dependencies, queues, and service behavior |
| Automation potential | Useful for human-triggered workflows and approval steps | Strong for scripts, pipelines, repeatable commands, and agent-driven operations |
| Onboarding | Easier for people who don't know the system's command vocabulary | Requires familiarity with shells, tools, paths, permissions, and failure modes |
| Auditability | Provides centralized activity records and visible lifecycle events | Produces command history and file changes, but may need additional collection |
| Recovery | Suitable for standard restart, stop, start, and teardown actions | Better for unusual failures that need several diagnostic steps |
A CLI workflow also benefits from composability. You can direct output into another tool, filter a log, compare configuration files, or run the same diagnostic procedure against several environments. The workflow becomes an executable artifact rather than a sequence of gestures that only exists in someone's memory.
The CLI overview is useful for teams that want terminal-based control over agent management rather than opening a browser for every routine action. That doesn't make the dashboard unnecessary. It gives operators another entry point for the same operational system.
Where the console wins
A dashboard is the better tool when the question is organizational or visual:
Which agents are active? A shared overview prevents operators from investigating machines that are already stopped or healthy.
Who can access the environment? Invite-only controls and visible team membership are easier to review in a central interface.
What is the lifecycle state? Provisioning, running, idle, expired, and failed states should be understandable without reading process output.
What changed recently? Audit logs and recent activity give non-specialists a safe way to review operations.
A GUI also reduces the risk of an operator running a command in the wrong environment. That safeguard matters when a team manages development previews, staging machines, and production-adjacent systems at the same time.
Where the shell wins
The terminal takes over when a standard control doesn't explain enough. It can show the exact command that failed, the dependency that wasn't found, the worker that exited, or the configuration file that differs from the expected version.
Use it for diagnosis, not ceremony. Opening a shell just to feel closer to the infrastructure adds no value. Opening one to test the database connection from inside the devbox, inspect the queue, or reproduce the failing command gives you information the dashboard may not expose.
Real-World Devbox Deployment Workflows
A practical agent workflow starts in the GUI because provisioning is a lifecycle decision. A developer selects a repository and branch, creates a devbox, and lets the platform detect the application stack. The result is a running environment with the application, its supporting services, and a preview URL that another person can open in a browser.
This approach removes unnecessary setup from the first pass. A repository such as a Next.js or Django application can move from branch selection to a live preview without every engineer writing a container command, configuring local SSH access, and documenting a separate environment.
The lifecycle model described in cloud development environments is particularly useful for preview-driven work. The agent creates or updates the environment, the platform runs the branch, and a human tests the result through a real URL instead of relying only on the agent's description.
Start with the visual lifecycle
A reliable deployment sequence looks like this:
Select the source. Choose the repository and branch that the agent has changed. Confirm the branch before provisioning, especially when several agents are working on related tasks.
Create the devbox. Let the platform inspect the repository and identify the expected stack. Treat automatic detection as a starting point, not proof that the application is healthy.
Open the preview. Test the page as a user would. Check the main route, an important authenticated path, and any feature directly affected by the branch.
Read the deployment state. If the preview fails, record the visible error and move to the live terminal rather than repeatedly redeploying.
The GUI is strongest during this stage because it keeps the human focused on lifecycle and product behavior. You're deciding whether the branch is available and testable, not manually shepherding every process.
Move to the shell for evidence
The in-browser terminal is where the investigation becomes specific. Read raw application logs instead of relying on the final agent summary. Check whether the database process is reachable, inspect queue status, verify that the expected worker is running, and restart only the component that is stuck.
A useful debugging order is:
Application output first. Find the earliest meaningful error, not just the final cascade of failures.
Process state next. Confirm which services are running and whether a worker repeatedly exits.
Dependencies after that. Verify that the expected packages, environment values, and generated files exist inside the devbox.
Recovery last. Restart a service or rerun a command only after you understand what failed.
This order prevents a common mistake in AI-assisted development: hiding the original error under several automatic retries. A clean redeploy can be useful, but it can also erase the evidence needed to improve the agent's instructions or the repository configuration.
The video below shows the kind of visual and terminal interaction that makes this workflow practical.
After the fix, return to the preview URL and test the user path again. The GUI confirms that the environment is healthy for the team, while the terminal preserves the operational detail needed if the same failure returns.
The Hidden Accessibility Gap in Command Lines
Many developers assume that a command line is automatically more accessible than a graphical interface. Text can work well with screen readers, keyboard navigation, and low-bandwidth connections, but text alone doesn't create an accessible experience.
A Google research paper found that the literature lacked a systematic evaluation of CLI accessibility. In a study involving 12 developers using screen readers, the central issue was that command lines are unstructured text interfaces, not interfaces that become accessible by default through the use of characters alone. The research on command-line accessibility challenges the simplistic claim that terminals are naturally inclusive.
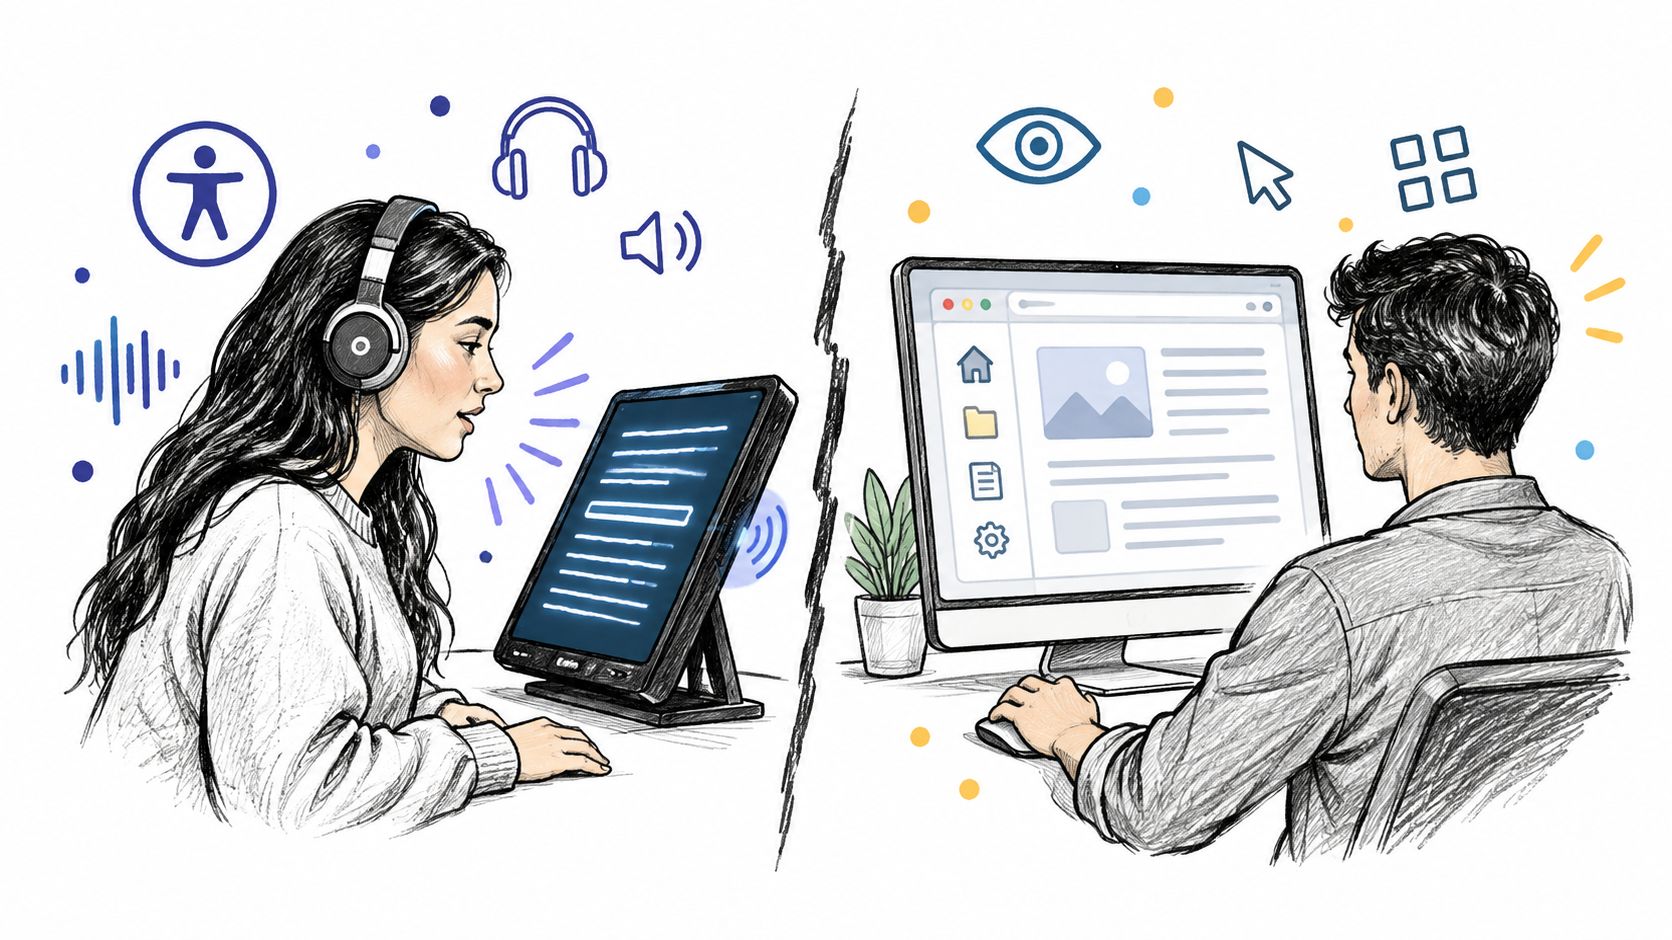
A terminal can emit a rapidly changing stream of status messages, warnings, progress indicators, tables, and cursor movements. A screen reader may receive the words, but not the relationships between them. If a command redraws a line repeatedly or places a failure message far from the command that caused it, the user still has to reconstruct the meaning.
Structure matters more than medium
Accessible CLI output needs deliberate design. Developers should use stable headings, predictable ordering, clear error messages, and output modes that avoid unnecessary animation. Scripts should provide machine-readable results where appropriate, while preserving a human-readable summary for interactive use.
The same principle applies to dashboards. A visual console can be difficult to use if controls lack meaningful labels, status depends only on color, focus order is inconsistent, or logs update without announcing important changes. A well-structured GUI may be easier for some team members to use than a raw terminal, particularly when it presents agent state through labeled regions and predictable controls.
There isn't one universal winner:
For keyboard-first work, a terminal may be efficient when commands, output, and history remain stable.
For visual state comparison, a dashboard may communicate relationships between agents more clearly.
For screen-reader use, both interfaces require semantic structure and predictable updates.
For onboarding, a GUI can reveal available actions that a shell expects users to discover independently.
Design the workflow for the team
Accessibility should influence the operating procedure, not just the interface choice. Document the meaning of status states, provide text alternatives for visual alerts, avoid making color the only indication of failure, and make important logs available in a stable format.
A no-code agent workflow can reduce the number of shell commands a new operator must learn, but it still needs clear status and accessible output. Teams evaluating no-code agent workflows should ask whether a person can understand what the agent did, what remains unfinished, and how to recover without depending on a single visual cue.
The right question is not “Is the CLI accessible?” It is “Can every person responsible for this workflow perceive the state, understand the result, and take the next action?”
Infrastructure Design and Configuration Transparency
The interface debate becomes less useful when the infrastructure underneath it behaves like a black box. A polished dashboard can make deployment feel simple, but teams still need to know what the system is running, which settings apply, and how to reproduce the environment after a failure.
The strongest design pairs a visual representation of state with readable configuration. Plain-Markdown files provide a practical source of truth because engineers can inspect them, review changes in git, and update them without translating a form into an undocumented system state.
Separate representation from authority
The GUI should represent the current state and expose safe controls. Configuration files should explain how that state was defined. Those responsibilities complement each other:
The dashboard communicates status. It shows whether an agent or devbox is active, failed, waiting, or ready for review.
Markdown records intent. It makes agent instructions, environment expectations, and operational conventions visible to the team.
Git records change. Reviewers can compare revisions, identify who changed a setting, and restore a known configuration.
The terminal verifies reality. Engineers can compare the declared configuration with files, processes, and logs on the live machine.
This model avoids two common failures. The first is GUI-only configuration, where a setting exists somewhere in a form but nobody knows how to reproduce it. The second is CLI-only operation, where the system is technically controllable but difficult for the wider team to observe.
A visible control is not the same as a transparent system. The team needs both a status view and a readable source of truth.
Isolate the machine that does the work
Agent hosting also benefits from separating each agent's execution environment from the management interface. When an agent is running code, building an application, or processing a large workload, those operations shouldn't make the dashboard sluggish or obscure the state of other agents.
One-agent-per-machine designs address that operational boundary. The agent and its devbox have room to run their workloads, while the control plane remains available for inspection and lifecycle actions. Isolation doesn't remove every failure mode, but it makes failures easier to attribute because the operator can connect a behavior to a specific environment.
The same principle applies to terminal access. A live shell is valuable only if it opens into the machine where the problem exists. A local terminal connected to the wrong environment creates false confidence, particularly when file paths and installed dependencies look similar across machines.
Configuration transparency therefore has three layers: a dashboard for shared awareness, versioned files for declared intent, and a live terminal for verification. Remove any one of them and the workflow becomes harder to trust.
Situational Recommendations for Engineering Teams
The right interface depends on the person making the decision and the risk of the action. Don't force a product manager into a shell to review an agent's progress, and don't ask a DevOps engineer to click through a repetitive recovery process that belongs in a script.
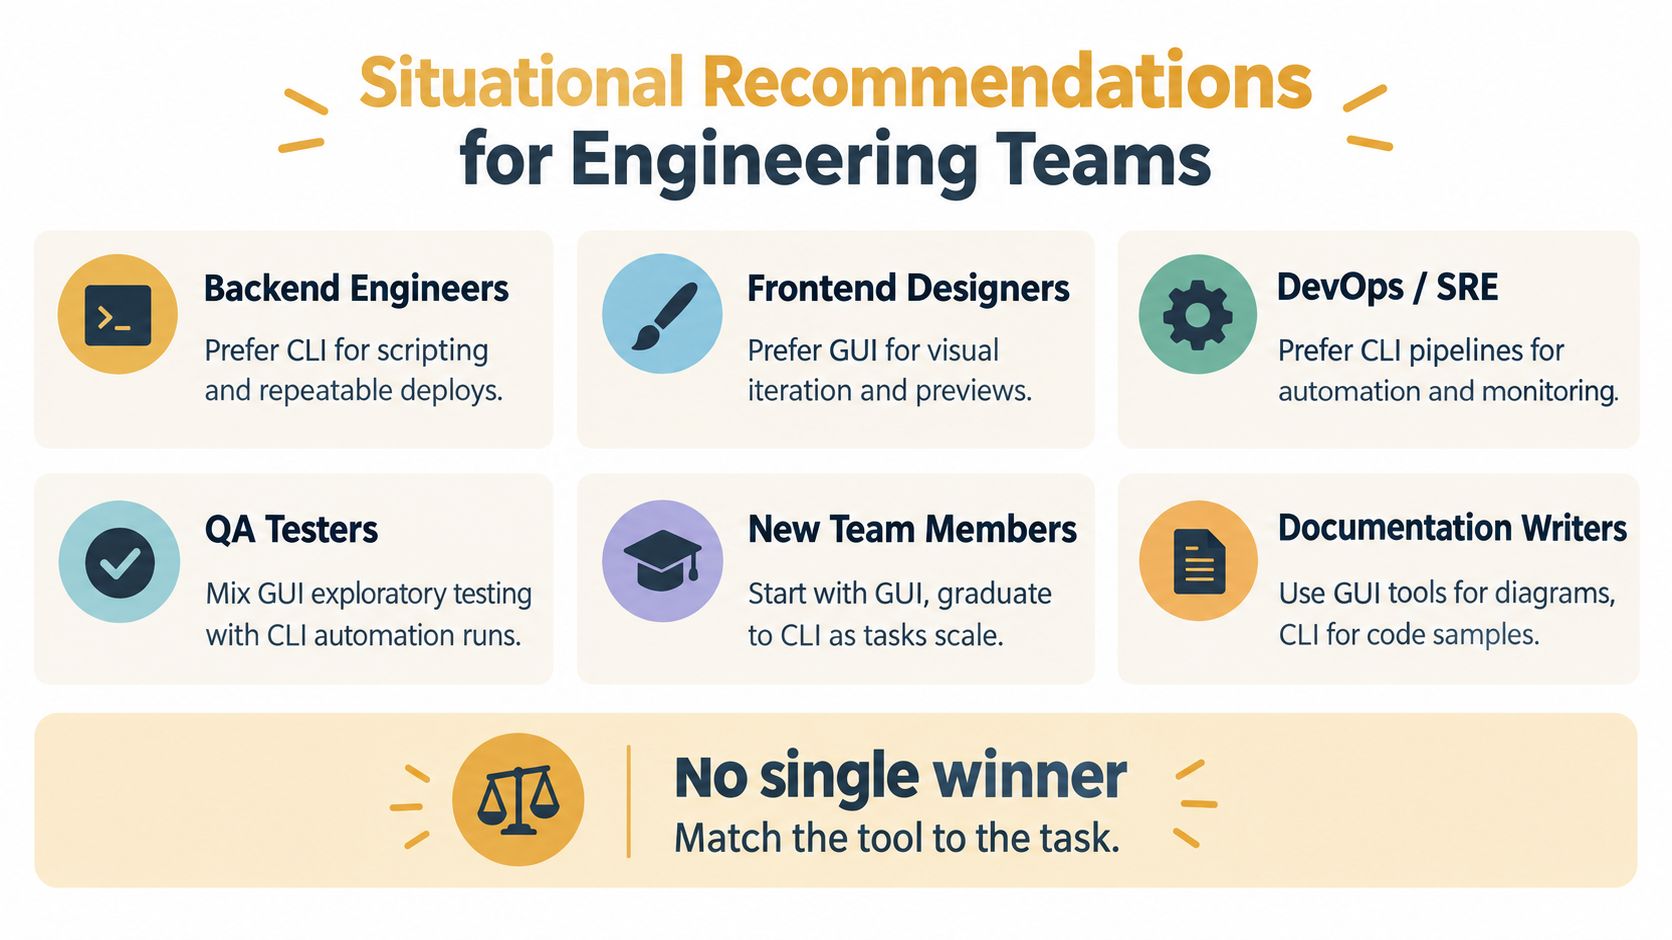
Use this decision matrix as a working default:
| Immediate goal | Start with | Why |
|---|---|---|
| Review whether agents are healthy | GUI | It provides shared fleet context without requiring machine-by-machine inspection |
| Debug a failed CI or deployment step | CLI | Raw output, process state, and filesystem inspection usually reveal more than a summary |
| Approve a feature preview | GUI | A preview URL and visible lifecycle state support browser-based review |
| Repeat a deployment or diagnostic routine | CLI | Scripts make the procedure consistent and reviewable |
| Check access, audit events, or shared memory | GUI | These are team-level concerns that benefit from centralized visibility |
| Investigate an isolated machine | CLI | The shell exposes the exact environment where the behavior occurred |
| Onboard a new operator | GUI first | Visible controls provide context before the operator learns the command vocabulary |
| Manage many similar environments | Both | Use the GUI for oversight and the CLI for repeatable execution |
A DevOps engineer should reach for the terminal when debugging pipelines, reproducing a failed command, or building an automated recovery path. A product manager should stay in the web console when reviewing previews, agent audit activity, or shared project context. An agency managing separate client environments needs the GUI for access boundaries and fleet oversight, then the CLI for client-specific technical intervention.
The operating principle is simple: choose the interface that matches the reversibility and repetition of the task. Use visual controls for shared decisions and standard lifecycle actions. Use terminal access for evidence, precision, and automation. Treat neither one as a complete replacement for the other.
Sokko provides managed always-on AI agents, isolated devboxes, a web console for fleet oversight, and live in-browser terminal access for debugging and automation. If your team wants agents to deploy repository branches into testable previews while keeping configuration and machine access visible, visit Sokko to explore the platform.